Grafana with Prometheus on Rocky Linux 9
AWS-Marketplace
https://aws.amazon.com/marketplace/pp/prodview-5bpharqr3csua
Usage Instructions
Note:
Before you start to access the system, please ensure the status of the instancein the AWS Console turns to Green, or the initialization process might be interrupted and the software configuration fails. It takes about 1-3 mins.
How to use
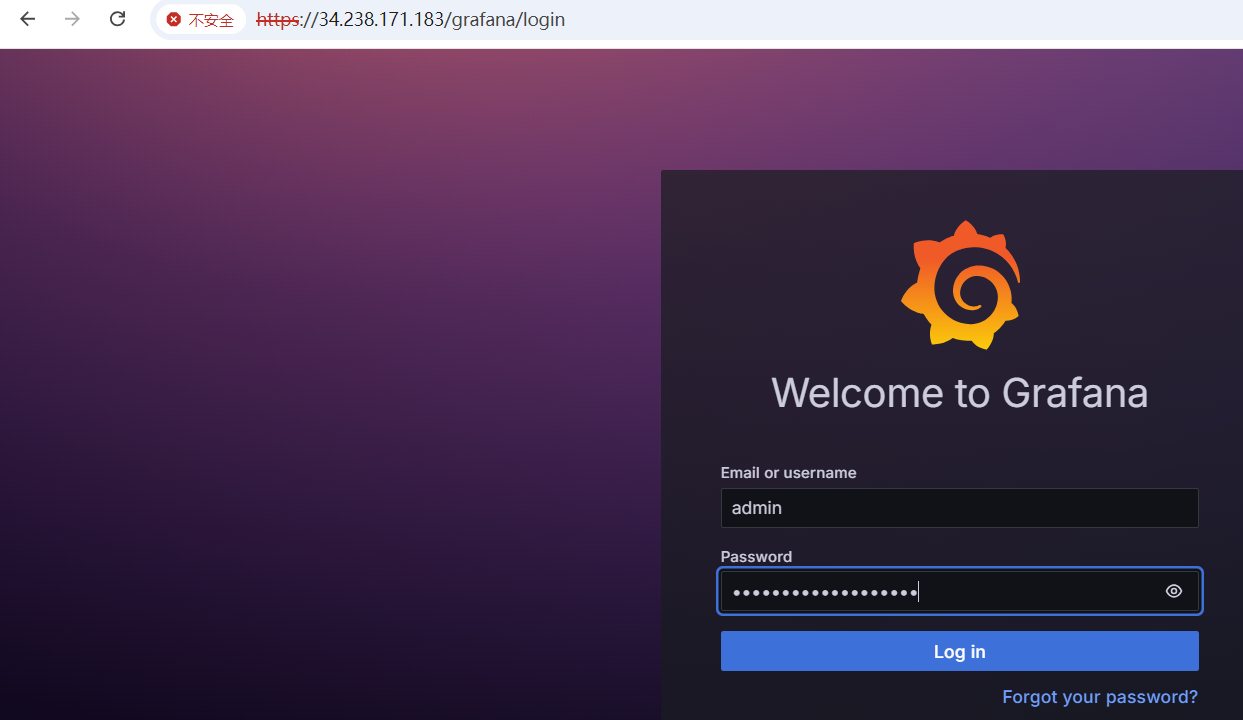
1.Access the grafana via web browser at https://instance-public-ip/grafana,and use ‘admin’ as username and ‘instance-id’ as password.
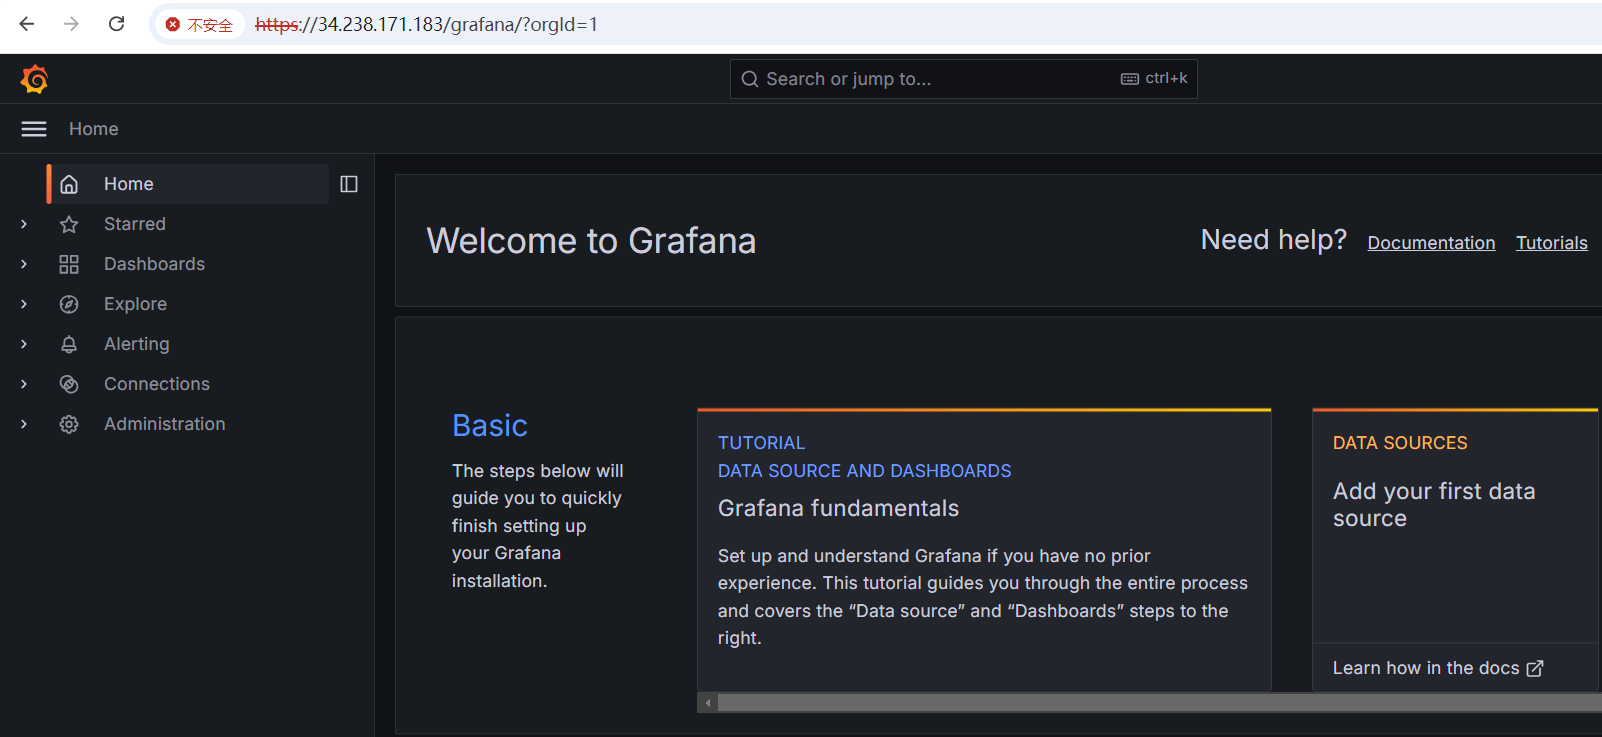
2.Access success
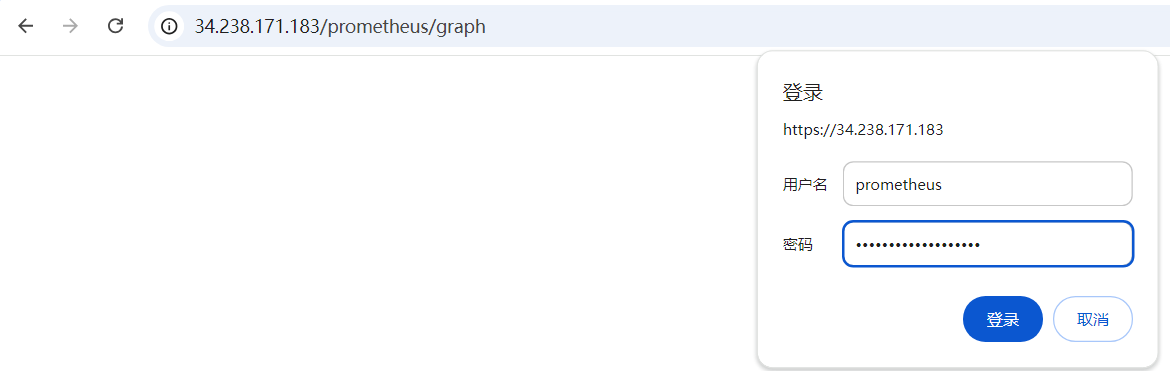
3.Access the prometheus via web browser at https://instance-public-ip/prometheus ,and use ‘prometheus’ as username and ‘instance-id’ as password.
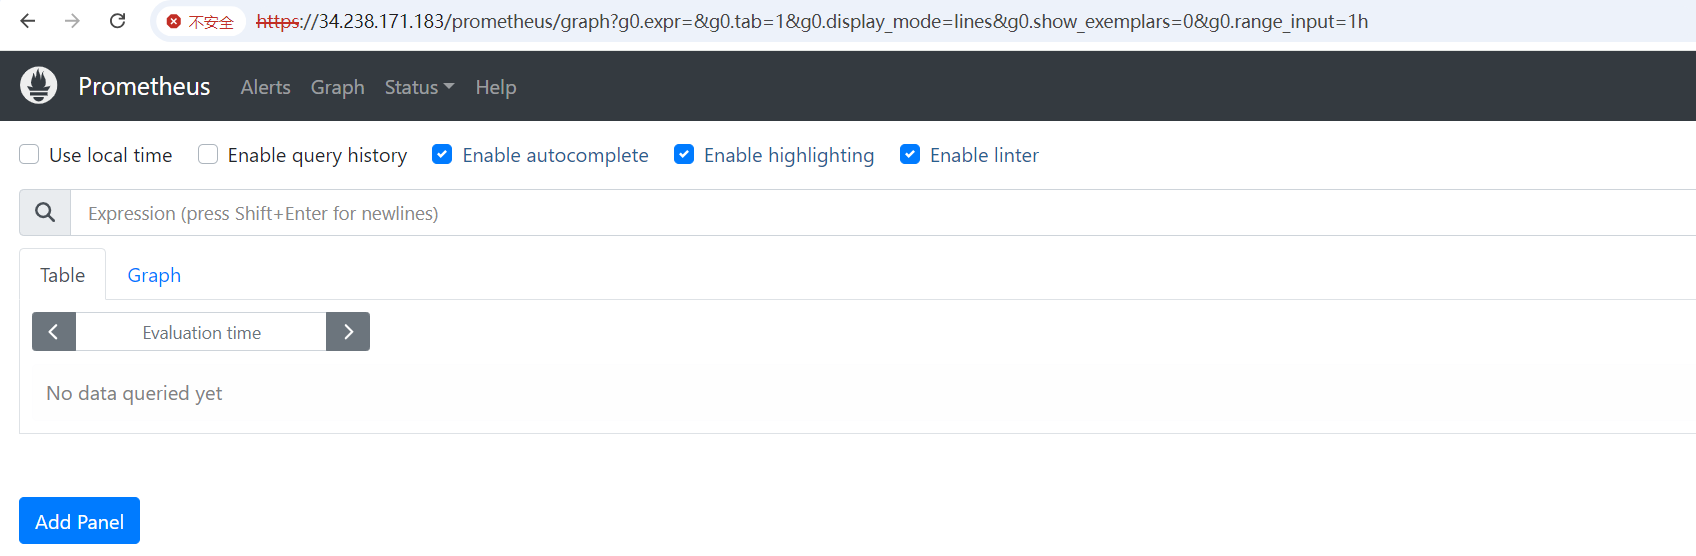
4.Access success
Optional:
Prometheus 2.54.1 /usr/local/prometheus
Grafana 11.2.0 /usr/share/grafana/
Nginx 1.26.2 /usr/share/nginx
Prometheus Services:
To start/stop/restart/status prometheus service: sudo systemctl start/stop/restart/status prometheus
Grafana Services:
To start/stop/restart/status grafana service: sudo systemctl start/stop/restart/status grafana-server
security Ports:
Port 22 and Port 443
nginx configuration location:
SSL /etc/nginx/ssl

web /etc/nginx/conf.d/prometheus-grafana.conf
The firewalld is enabled and selinux is enforcing.
Support
If you encounter problems in the process of using the system, please contact us by email, thank you! support@fastimg.top